Pandemic Log
September 10, 2020
COVID-19 SCHOOL RISK PROBABILITY MODEL
I developed the probability model outlined below to estimate the risk of a COVID-19 case arriving in my children’s school on Vancouver Island in BC. While working on it, I realized the model might be generally useful for parents trying to decide whether to send their kids back to school, or when to remove them from school if cases of the disease soar in their region. I’ve consulted with folks with expertise in statistics and public health to check my approach.
This isn’t a model of infection or transmission but, rather, of the probability of a case being present in a community of a given size, given current evidence of infections rates. It’s extremely simple, and I show below how you can plug the relevant numbers for your own health region into the formulas. But keep in mind that such simple models offer both benefits and risks. The benefits are legibility (you can see how the model works) and ease of use. The main risk is lack of accuracy in the model’s representation of the world. I’ve tried to note some the ways I think this model is inaccurate. Please write me at tad@homerdixon.com with your comments and suggestions, which I’ll summarize in future posts.
Headline results:
I’ve prepared the following table to summarize the model’s headline probabilities for the Vancouver Island health region. I’ve provided estimates for three school sizes (total population of children and adults). The highlighted columns represent the probability estimates for a school of that size as of September 10. (Vancouver Island’s 10- day average of documented daily new cases was 1.0 on that day.) To show how probabilities could change with higher daily case counts, I’ve provided two additional sets of estimates for each of the three school sizes.
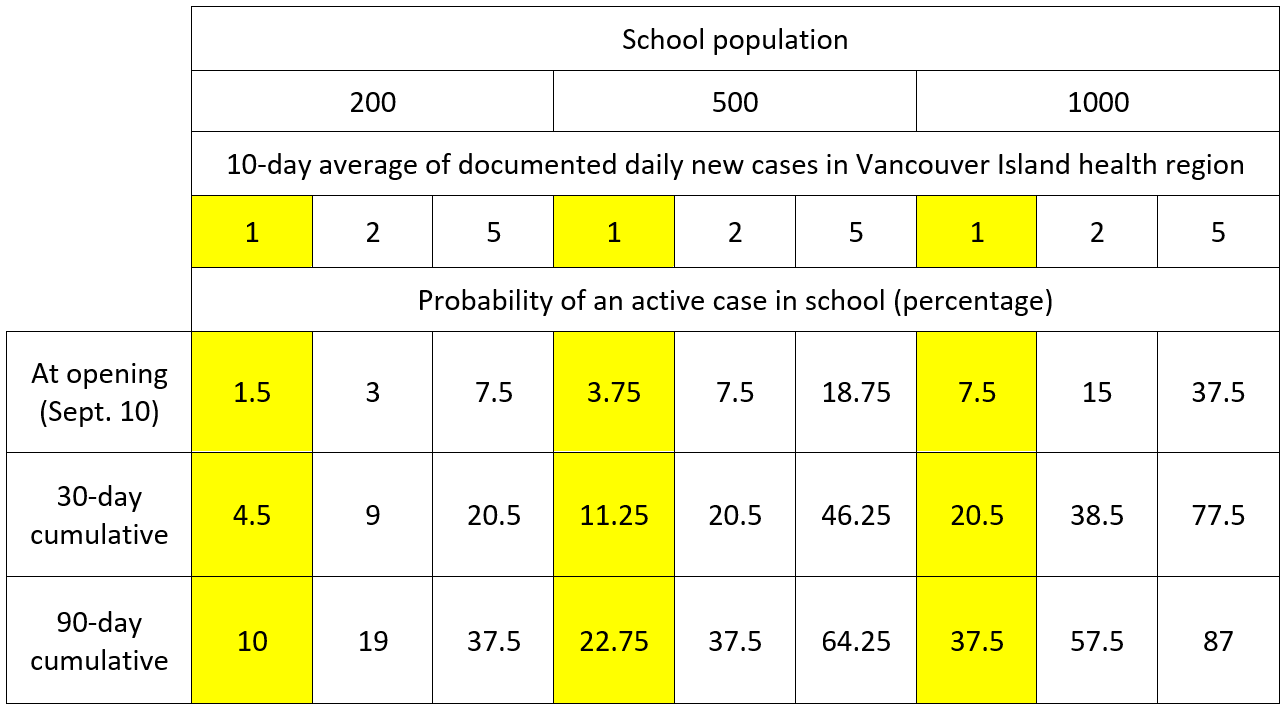
The model’s most interesting result is the growth in cumulative risk over time. In a large school, even a low infection rate in the general population—say, one case per day—produces a very substantial risk of an infection entering the school by the end of the fall term. And if we get to an average of 5 cases per day, the cumulative risk is high even for small schools.
Also the difference between one and two documented infections on average per day is notable. Both seem like low infections rates (“What’s two cases a day?”), but the change from one to two drives the 90-day cumulative average for even a small school of 200 students close to 20 percent.
In the following sections, I run through the model using, as an example, a small school of 200 people in Victoria and the September 10 average daily documented rate of infections for the Vancouver Island health region.
Model inputs:
-
- 1. ADC: “Average daily cases,” which is the 10-day average of the health region’s
documented
-
- new cases. Source:
- . I use 10 days to extend the sample beyond one weekly reporting cycle. ADC for Vancouver Island health region, August 30 through September 8: 1.0.
- 2. Total population of Vancouver Island health region: 850,000 people.
- 3. Total school population: 200 students and adults.
Model assumptions:
- 1. Active cases are individuals who can transmit the disease to others, and vice versa.
- 2. Symptomatic cases are active.
-
- 3. All publicly documented cases in BC are symptomatic. (This assumption is not entirely valid, but it helps keep the calculation manageable.
- currently focuses on symptomatic individuals. “In B.C., testing is generally not available through the provincial health care system for people without symptoms.”)
-
- 4. Cases are active for an average of 14 days. (Based on
- infected individuals are contagious 3 to 4 days prior to symptoms, in symptomatic cases, and 10 days subsequent to the appearance of symptoms; the same duration of infectivity is assumed for asymptomatic cases.) So, a given population’s cohort of active cases consists of 14 daily tranches. Each day the population loses a single-day’s tranche of active cases (those cases that have been active for 14 days and have now become inactive) and adds another tranche of new, active cases. Those new cases will take 14 days to move through the active cohort to become inactive.
-
- 5. ADC represents 20 percent of total number of
actual daily, symptomatic cases
-
- in the region. In other words, the population’s
real
-
- number of symptomatic cases on any given day is
five times
-
- larger than the number documented by testing. NB: The large majority of people exhibiting symptoms won’t or can’t get tested, either because they’re afraid of the result, in denial, think it’s “just a cold,” or can’t access testing because of blockages in the testing system. This assumption is influenced by information on the efficacy of the testing system; the more efficacious testing is, the closer the ADC gets to the real number of symptomatic cases in the population.
- suggest that many people on Vancouver Island have recently had difficulty accessing testing.
-
- 6. The asymptomatic fraction in the general population is 45 percent (
- )
NB
-
- : Together, assumptions 3 through 5 mean that, in BC, a population’s
total number of active cases
- at any one time, or its “TAC,” equals:
((ADC * 5)/0.55) * 14
-
- One takes the 10-day average of daily cases (the ADC), multiplies by 5 to get the average of
symptomatic
-
- cases per day, divides by 0.55 (the complement of the asymptomatic fraction) to get the average of symptomatic and asymptomatic cases per day
together
- , and then multiplies by 14 (to account for the 14 days of consecutive tranches of active cases) to get the population’s total number of active cases.
-
- 7. Susceptibility to infection of school-aged children is 50 percent of that of adults (
-
- ). NB: Although this assumption is in line with that of the MAGPIE modelers at SFU (see the CP report
- ), I’m not confident in it; my reading of the research leads me to think children’s susceptibility is much closer to that of adults.
Calculation of probability of an active case in a school of 200 people on September 10, 2020:
-
-
- Average daily cases for ADC for Vancouver Island health region (August 30 through September 8) is 1.0.
-
- Total active cases (TAC) in VI health region: ((1*5)/0.55)*14 ≈ 127
-
- Ratio of population to TAC for VI health region: 850,000/127 = 6,693; i.e., VI health region currently has one active case for every ~6,700 people.
-
- Probability that one of these active cases will be in a school of 200 people: 200/6,700 ≈ 3.0 percent.
-
- Discounted by lower susceptibility to infection of school-aged children (assumption 7): 3.0 *. 0.5 = 1.5 percent.
-
- NB: The above calculation assumes that the lower susceptibility applies across the entire school population, including the adults, who usually make up about 10-15 percent of a school community; the consequence is a slight underestimation bias in the probability estimate. Also, technically, the lower susceptibility figure should be integrated earlier in the calculation. That is, the health region’s total population should be disaggregated into sub-populations of different susceptibilities, and then the discrete probabilities that a member of each sub-population will be in the school community should be summed. But we don’t have enough data about susceptibility of sub-populations to COVID-19 to justify such disaggregation. And integrating the susceptibility figure at the end of the calculation likely produces a similar result.
-
Cumulative probability of an active case in a school of 200 over one month and over three months:
If, as each day passes, one tranche of cases drops out of the VI health region’s active-case cohort and another one enters, each day produces a discrete additional risk that a new case will enter the school community. The following calculation assumes that the ADC stays constant at 1.0. (This assumption will that have to be adjusted on an ongoing basis, in line with new BCCDC data.)
-
-
- New active cases per day in VI region: (ADC * 5)/0.55 = (1*5)/0.55 ≈ 9.
-
- Ratio of population to new active cases per day for VI region: 850,000/9 = 94,444; i.e., one new case appears each day in the VI health region for every ~95,000 people.
-
- Probability that one of these new active cases will enter the school community in a day: 200/95,000 = 0.21 percent.
-
- Probability that no new active cases enters the school community in a day (the complement of the above percentage): 99.79 percent.
-
- Probability that no new cases will enter the school community over one month (or 30 days) is the joint probability of the 30 discrete daily probabilities: 0.9979^30 ≈ 0.94 (using this online calculator) or 94 percent.
-
- Probability of a new active case entering the school community over one month: 6 percent (the complement of the above figure) * 0.5 (for reduced susceptibility) = 3 percent.
-
- Total probability of an active case in the school from opening through the first month: 1.5 (opening probability) + 3 (cumulative probability) = 4.5 percent.
-
- Probability of a new active case entering the school community over three months (90 days): 0.9979^90 ≈ 0.83 or 83 percent.
-
- Probability of a new active case entering the school community over three months: 17 percent (the complement of the above figure) * 0.5 (for reduced susceptibility) = 8.5 percent.
-
- Total probability of an active case in the school from opening through the first three months: 1.5 + 8.5 = 10 percent.
-
Of course, the presence of an active case in a school does not mean that case will cause other infections. Whether or not it does cause other infections depends on, among various factors, the effectiveness of the school’s infection-control protocols. But here’s a key fact: About 80 percent of cases among children are completely or mostly asymptomatic (or “subclinical,” up from about 45 percent across the whole population) according to Davies et al. 2020. So most of the time parents and administrators won’t know when an infection is present in a school. Once COVID-19’s presence in a school is evident, perhaps because a sick kid has infected a teacher or other adult, then isolation and contract tracing will start.
A final caveat: This kind of approach to estimating probabilities implicitly assumes that infections appear more-or-less randomly throughout the population as time passes. But of course the spread of a virus like SARS-CoV-2 from person to person ensures that infections will be clustered or clumped in the population. Clustering tends to reduce the probabilities that an infection will appear in a given school community; so this model’s assumption of randomness will tend to overestimate those probabilities. But this bias, I believe, is largely counterbalanced by the underestimation biases noted above (especially that arising from assumption 7).
September 8, 2020
AEROSOL TRANSMISSION: The latest science
1. The case for aerosol transmission
The evidence that the SARS-CoV-2 virus, which causes COVID-19, can be transmitted through aerosols—tiny airborne particles that a person can emit by talking and even just by breathing —is now extremely strong. This evidence has accumulated through multiple lines of research, including careful analysis of transmission in a Korean call center (Park et al. 2020, peer-reviewed), at a Chinese restaurant (Li et al. 2020, pre-print), and at a Washington State choir practice (Hamner et al. 2020, peer-reviewed). Aerosols with viral RNA were observed in Nebraska hospital rooms with COVID-19 patients (Santarpia et al. 2020, peer-reviewed). Viable virus has been isolated and cultured from aerosol droplets nearly 5 meters from infected COVID-19 patients (Lednicky et al. 2020, pre-print).
Researchers from Harvard and the Illinois Institute of Technology (Azimi et al. 2020, pre-print) have developed a detailed mathematical analysis of transmission routes on the Diamond Princess cruise ship. They found that short-range (< 1.2 meters), long-range (> 1.2 meters), and fomite (surface) transmission contributed 35, 35, and 30 percent respectively to infections on the ship. They additionally estimated that nearly 60 percent of infections were a product of transmission through inhalable aerosol (under 10 microns in diameter). They write:\
[A]erosol inhalation was likely the dominant contributor to COVID-19 transmission among passengers aboard the Diamond Princess Cruise Ship. Moreover, close-range and long-range transmission likely contributed similarly to disease progression aboard the ship, with fomite transmission playing a smaller role. The passenger quarantine also affected the importance of each mode, demonstrating the impacts of the interventions. Although cruise ships represent unique built environments with high ventilation rates and no air recirculation, these findings underscore the importance of implementing public health measures that target the control of inhalation of aerosols in addition to ongoing measures targeting control of large droplet and fomite transmission, not only aboard cruise ships but in other indoor environments as well.
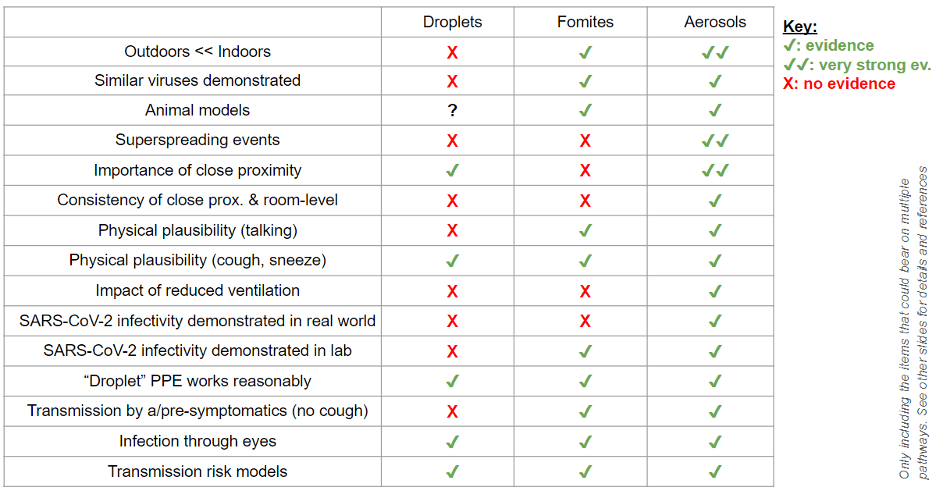
Jose-Luis Jimenez, a professor chemistry at the University of Colorado-Boulder, and a Fellow of the American Association for Aerosol Research, summarized the case for aerosol transmission on August 25 in Time Magazine. His technical slide deck presents detailed evidence and includes the following slide.
A letter by 239 epidemiologists to the World Health Organization (WHO), published in Clinical Infectious Diseases on July 6 (Morawska and Milton 2020, peer-reviewed) appeals “to the medical community and to the relevant national and international bodies [specifically the WHO] to recognize the potential for airborne spread of COVID-19.” The letter continues:
There is significant potential for inhalation exposure to viruses in microscopic respiratory droplets (microdroplets) at short to medium distances (up to several meters, or room scale), and we are advocating for the use of preventive measures to mitigate this route of airborne transmission.
Studies by the signatories and other scientists have demonstrated beyond any reasonable doubt that viruses are released during exhalation, talking, and coughing in microdroplets small enough to remain aloft in air and pose a risk of exposure at distances beyond 1 to 2 m from an infected individual (see e.g. [1-4]). For example, at typical indoor air velocities [5], a 5 μm droplet will travel tens of meters, much greater than the scale of a typical room, while settling from a height of 1.5 m to the floor.
Some senior public health officials, most importantly at the WHO, but also within BC’s public health authority (see below), are resisting acknowledging weight of this evidence, likely because of its implications for policies on physical distancing, school openings, and mask mandates. Such resistance also seems to be rooted in a long-held scientific bias within epidemiological circles to “miasma” (i.e., “bad air”) theories of disease transmission, a bias that can be traced by to the work of the pioneering American public-health official, Charles Chapin, whose 1910 book The Sources and Modes of Infection profoundly influenced generations of public health officials.
2. Aerosols and masks
Research now strongly indicates that masks protect both the wearer and people near the wearer by interfering with the mobility of aerosol particles, thus reducing the distance these particles can travel and the viral load that people inhale (Gandhi, Beyrer, and Goosby 2020, peer-reviewed). The rate of asymptomatic infection appears to rise with a population’s use of masks, because masks appear to reduce the “inoculum,” or the dose of virus inhaled. Gandi, Beyrer, and Goosby note that some of the most striking evidence of this relationship comes, again, from studies of infections abord cruise ships:
One of the earliest estimates of the rate of asymptomatic infection due to SARSCoV-2 was in the 20% range from a report of a COVID-19 outbreak on the Diamond Princess cruise ship. In a more recent report from a different cruise ship outbreak, all passengers were issued surgical masks and all staff provided N95 masks after the initial case of COVID-19 on the ship was detected. In this closed setting with masking, where 128 of 217 passengers and staff eventually tested positive for SARSCoV-2 via RT-PCR, the majority of infected patients on the ship (81%) remained asymptomatic, compared with 18% in the cruise ship outbreak without masking.
As of September 2, thirty-four US states and nearly all European, Asian, and African countries now have some kind of mask mandate. Evidence from Asia countries suggests that the widespread use of masks can significantly reduce COVID-19’s reproduction rate (Li et al. 2020).
Health authorities in BC should immediately mandate the use of masks in all public, indoor spaces, including transit, in middle and secondary schools, and in situations where people are near each other outdoors. The time to implement such an order is now—before, not after, a fall surge of COVID-19 infections. Observations of behavior around the province indicate many people are becoming complacent; they seem to believe we’ve beaten the disease. But other jurisdictions, like Melbourne, thought they’d largely eliminated the virus too, and now they’re suffering the economic and social devastation of a second, far more severe lockdown.
3. BC’s mistaken position on aerosol transmission
The public policy response to COVID-19 in BC has been exemplary to date. The province’s citizens have been extraordinarily fortunate to have had exceptional leadership during this crisis. But BC’s public health officials are almost certainly mistaken when they argue that the risk of aerosol transmission of SARS-CoV-2 is minimal to non-existent.
On June 1, Dr. Réka Gustafson, B.C.’s deputy provincial health officer, told CTV Morning Live that “there is absolutely no evidence that this disease is airborne.” In a press conference on August 20, Dr. Gustafson reiterated this position, when she stated: “We have over 20 million infections around the world, and the behavior of this virus is now known. . . . This virus has told us how it’s behaving, and the way it’s behaving is not airborne spread.”
Considering the research cited above, such unequivocal statements are not scientifically defensible.
May 12, 2020
Science and Strategy
Three dominant strategies for economic recovery
Arguments about how societies should respond to the pandemic to minimize social and economic harm have coalesced around three dominant strategies:
-
-
- Seek herd immunity as quickly as possible without overwhelming the health care system.
- Aim for elimination of the SARS-CoV-2 virus in the population.
- Try to suppress the virus through changes in social and economic behavior and then wait until an effective vaccine or treatment is disseminated.
-
Each strategy has a distinct goal for the COVID-19 “attack rate,” which is the proportion of the population ultimately infected by the disease. The herd immunity strategy aims for an attack rate in the 60 to 80 percent range; elimination aims to cap the attack rate at a low level, perhaps (after the first wave of infections) under 10 percent; while suppress and wait aims to keep the ultimate attack rate as low as possible, while minimizing the economic damage that policy entails.
Those who advocate herd immunity generally say that societies can do little over the long run to limit the spread of COVID-19, so any effort to eliminate or suppress the disease is a waste of economic resources. By this view, societies should bite the bullet and get quickly through the process of letting the disease spread through the population, perhaps with some efforts to protect vulnerable people (elderly, people with preexisting conditions and the like) in the meantime. Those who support elimination adamantly disagree, saying that sufficient testing, contact tracing, border control, and targeted changes in social behavior can reduce COVID-19’s spread to zero and ultimately eradicate the disease from the population.
Each of the three strategies is being pursued in multiple jurisdictions around the world. Sweden is probably the best known instance of a country adopting the herd immunity strategy, but many US states, particularly across the South (Georgia, Tennessee, and Texas, being examples) have also essentially adopted this policy (whether or not they explicitly acknowledge doing so). New Zealand has officially adopted an elimination strategy and appears to have reached that goal about a week ago, according to The Lancet. China is pursuing elimination, and the strategy seems to be an unofficial policy target in South Korea, Singapore, and perhaps Australia. The physician Irfan Dhalla recently argued in the Globe and Mail that Canada could and should pursue elimination.
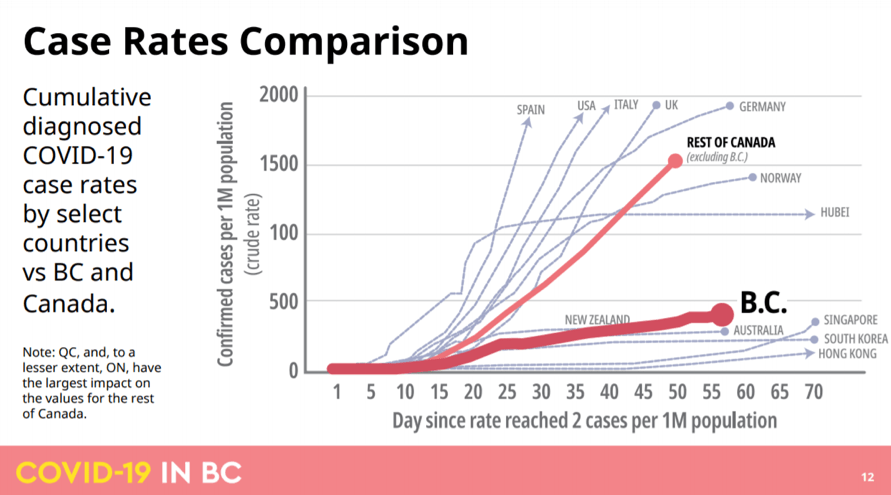
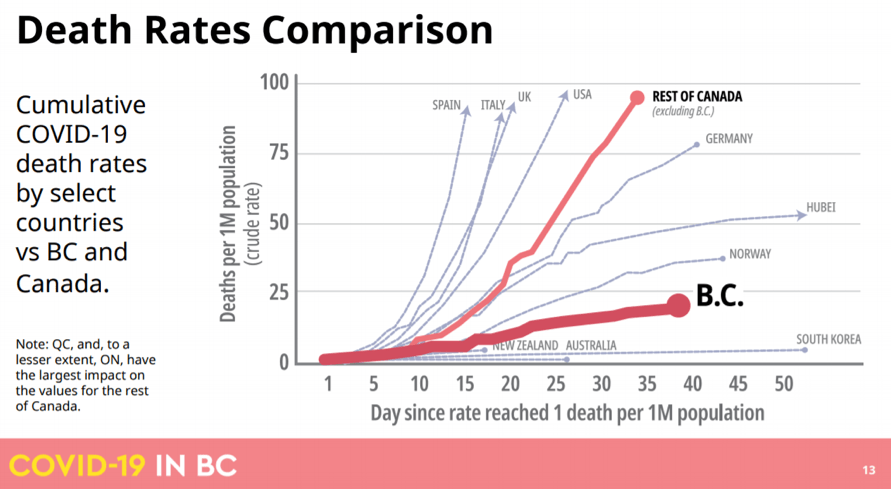
Almost all other jurisdictions in the world are pursuing (or are considering pursuing) some version of suppress and wait. The British Columbia plan, announced last week, is an excellent illustration of how such an approach might be implemented. It’s worth noting, in this context, that the public policy response to COVID-19 in BC to date has been exemplary, helping to put the province on a track close to those of jurisdictions pursuing elimination (see charts below).
Ideology and the three strategies
The debate among the advocates for these three positions has become ideologically charged: it’s increasingly reflecting, and even amplifying, pre-existing ideological polarizations in Western societies. Because ideological commitments are powerful sources of motivated inference, the more they become entangled with people’s views on the pandemic, the less people will be able to assess in a balanced way the rapidly unfolding scientific evidence on SARS-CoV-2 and COVID-19.
The clearest ideological contrast lies between advocates of the herd immunity and elimination strategies, which are extreme and (nearly) opposite positions on the continuum of policy responses.
Folks who believe in individual agency, who are skeptical of government regulation, or who are suspicious of technocratic elites have tended to gravitate towards the herd immunity strategy. In many cases, whether explicitly or implicitly, this attitude has now evolved into a form of social Darwinism, expressed, in its most offensive form, through statements on placards like “Let the strong survive.” It’s also often accompanied by contempt for science and public health experts, usually couched in claims such as “no one knows anything.”
Importantly, groups of people on both the traditional right and left of the political spectrum have migrated to the herd immunity ideological position on the pandemic. Both groups argue that the social response to the pandemic has involved widespread elite manipulation of the public’s fear. For those on the right, the manipulators are the regulatory state and the members of the liberal-technocratic elite who run it; for those on the left, the manipulators are the big corporations and the capitalist ruling class that controls the state apparatus.
Folks with a strong collectivist or communitarian impulse, who have an encompassing concept of the commonweal, and who have an ethical commitment to helping vulnerable members of society, have tended to gravitate towards the elimination strategy.
Implementing any of these three strategies will require applying multiple, interconnected policy tools to change people’s economic and social behavior—tools rarely tried before across large populations and modern economies. But while the three strategies are similar in this respect, compared to suppress and wait, the herd immunity and elimination strategies are more ideologically stable states for people, in large part because they involve fixed policy targets that are cognitively and normatively simple.
In contrast, the suppress and wait strategy requires policymakers to estimate whether the social and economic benefits of suppressing the disease, using various mixes of policy tools, exceed the costs of doing so. These estimates must be informed by moral and sociological judgements about factors such as the value of life, the strength of social solidarity, and the limits of individual responsibility. Because estimates of benefits and costs will change as the pandemic unfolds, as the relevant science advances, and as various policy tools are tried, any effective suppress and wait strategy will require constant, ongoing recalibration. And to ensure broad compliance, all estimates and judgments will have to be explained to the public in clear persuasive terms, including any reasons for sudden policy shifts as the situation evolves.
This suggests that supporters of the suppress and wait strategy will be at a grave political disadvantage if the pandemic’s economic and social disruptions continue to worsen and the ideological polarization around policy responses thereby deepens. The strategy depends on public trust in technical expertise, tolerance of uncertainty, balancing of multiple moral considerations, and above all patience in the face of fear—all of which may be in increasingly short supply.
Flies in the strategic ointment
Each of the three strategies has serious weaknesses. Elimination can work only if the borders of a province, state, or country can be controlled to keep the infection out, once it’s eliminated internally. Few jurisdictions have the combination of geographical isolation, economic independence, governmental capacity, and public compliance to make the strategy feasible. Suppress and wait assumes, perhaps far too optimistically, that the economic costs of effective suppression can be kept sufficiently low. It also depends crucially on the wide availability—within a socially realistic period, presumably not more than eighteen months from now—of an effective vaccine or treatment. But prospects for effective vaccines and treatments within that horizon are highly uncertain at best.
The false and dangerous promise of herd immunity
The herd immunity strategy is the most seriously flawed of the three. First, it assumes people who’ve had COVID-19 will have gained substantial and durable immunity, but little scientific basis yet exists for such an assumption. Although research published in the last week indicates that nearly everyone who has had the disease develops antibodies, antibodies don’t necessarily confer immunity, and even if they do, that immunity might not last for more than a few months. Writing in the Washington Post, Leana S. Wen, an emergency physician, professor of public health, and Baltimore’s former health commission says: “It’s unclear whether people acquire immunity after contracting covid-19. Even if those who recover become immune, an infection rate of 60 percent would mean nearly 200 million infected Americans. Millions could die.”
Wen also demolishes the idea that vulnerable segments of the population can be protected while herd immunity develops in the rest of the population:
“Older people aren’t the only ones contracting COVID-19. One in 5 patients requiring hospitalization in the United States are ages 20 to 44, the Centers for Disease Control and Prevention found in March. Infected people in their 30s and 40s are dying of strokes. Even if young people are not as likely as older individuals to become severely ill, they can be asymptomatic carriers who spread the virus.
Growing evidence suggests that children with mild or no symptoms can be highly contagious carriers. In New York, 66 percent of hospitalized COVID-19 patients appear to have been sheltering at home. This suggests they probably contracted the virus from someone close who had exposure to others.”
As Wen suggests, proponents of herd immunity tend to underestimate the severity of COVID-19 and its appalling complications for a significant fraction of those infected. New research indicates that the disease has been misunderstood as solely a respiratory infection; rather it’s best categorized as a systemic inflammatory illness that can attack multiple organs, including the lungs, heart, kidneys, liver, gastro-intestinal system and especially the endothelial cells that line blood vessels. A relatively high percentage of hospitalized patients, including some young patients, experience a cytokine storm, which is an out of control inflammatory reaction. Damage to blood vessels causes clots that precipitate strokes, sometimes in relatively young adults who have otherwise shown no symptoms of the disease.
Sweden is a success story?
As of May 11, Sweden, which is Exhibit A for proponents of the herd immunity strategy, had 3,256 documented COVID-19 deaths in total, or 322 deaths per million people. Neighboring countries Finland and Norway, both of which are pursuing the suppress and wait strategy, had 49 and 41 deaths per million, respectively. If we take the midpoint figure of 45 as the number of deaths per million that Sweden could have achieved had it adopted a suppress and wait strategy, it seems that Sweden’s pursuit of herd immunity has so far cost its population 2,800 lives.
The economic bottom line
The herd immunity strategy assumes that the main cause of the pandemic’s huge economic impact is government policy, through social-distancing and stay-at-home mandates and closure of businesses and industries. So if these restrictions are judiciously lifted, the logic goes, economic activity should rebound even before full herd immunity is achieved (a process that could take a year or two).
But lifting the restrictions won’t produce a quick return to anything resembling prior economic demand. The following table, which summarizes scientific findings regarding key properties of SARS-CoV-2 and COVID-19 (including the research cited above, and also research here and here) indicates why.
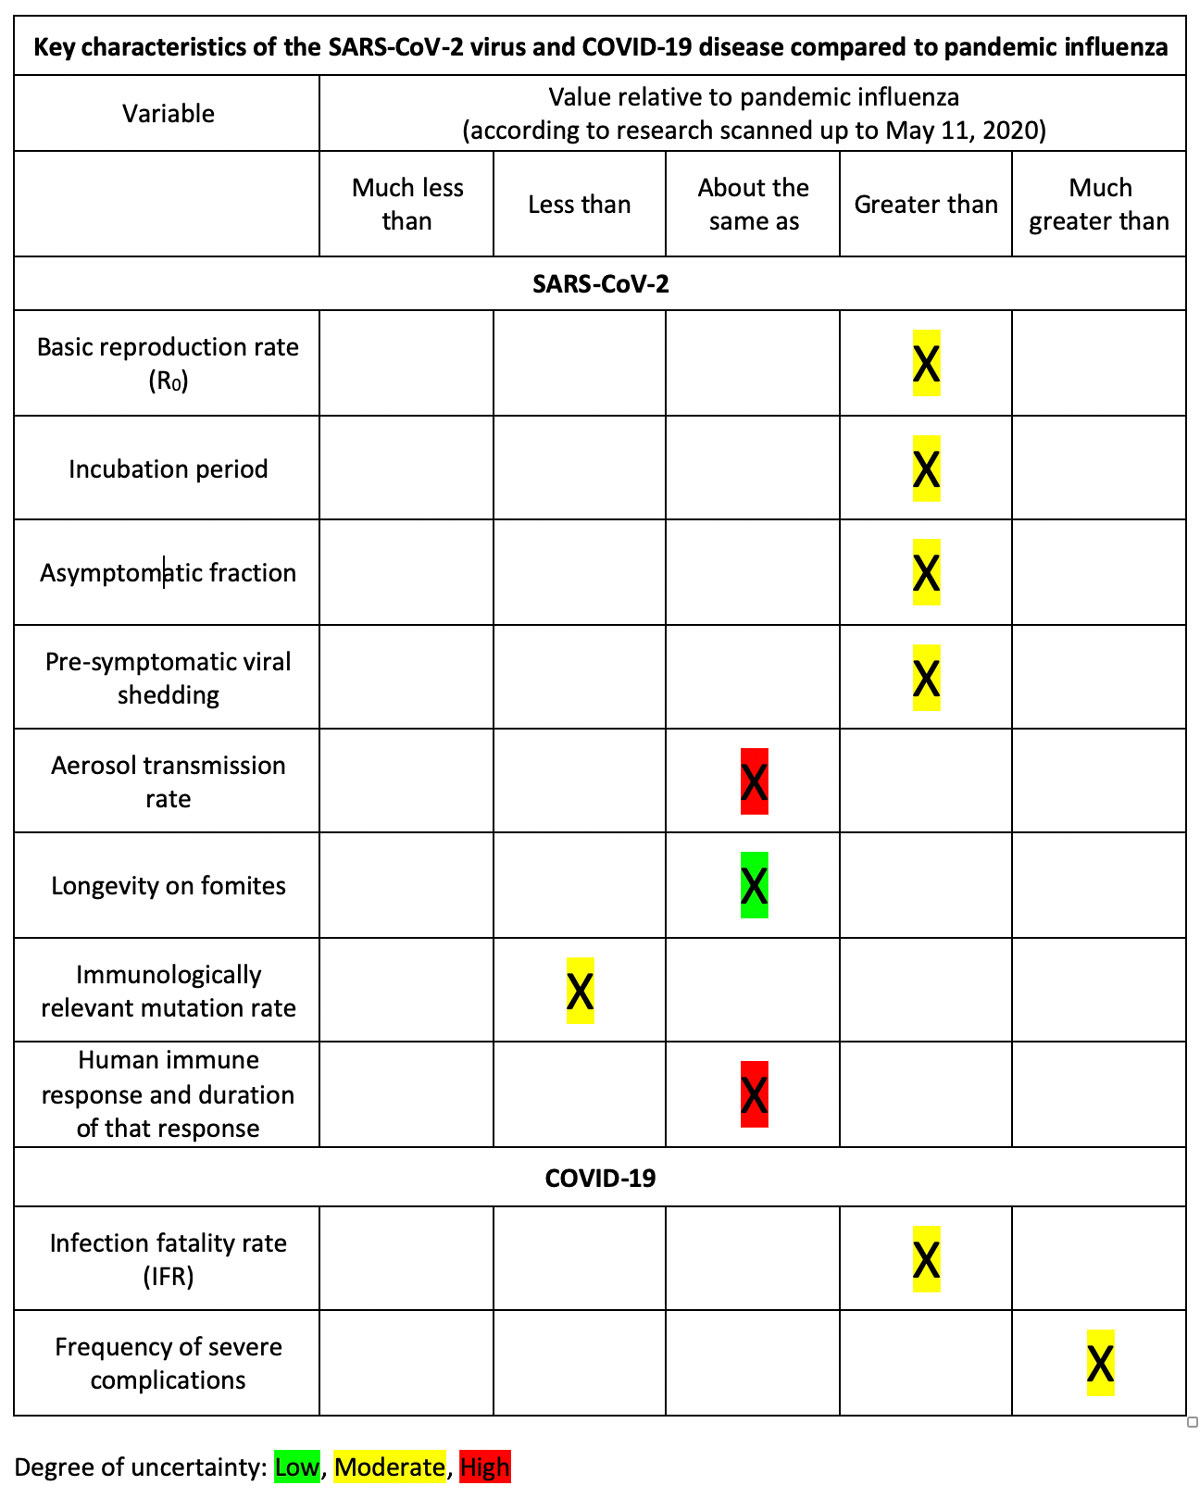
The table shows that, according to current scientific knowledge, SARS-CoV-2 is on balance a much more dangerous virus than the pandemic influenza viruses of 1918-19, 1957, 1968, and 2009-10. Because of its longer incubation period, higher asymptomatic fraction, and greater pre-symptomatic shedding, its overall transmissibility is substantially higher. COVID-19’s infection fatality rate (likely between 0.3 and 1 percent) is three to ten times higher than seasonal influenza, and its severe complications, among those who become seriously ill, are more frequent and broadly systemic.
These characteristics of the virus and disease will continue to create conditions of chronic fear and insecurity in populations where SARS-CoV-2 circulates, and this fear will significantly lower demand for any goods or services that require (for their consumption) social proximity, interaction, or congregation (especially indoors)—even if government removes all pandemic-related restrictions on the consumption of those services.
As long as SARS-CoV-2 remains in circulation, demand for goods and services such as airline seats, sit-down service in restaurants and pubs, movie tickets, music concerts, theater shows, in-class college and university education, academic and business conferences, and personal care services (physiotherapy, massage, hair care and the like) will remain depressed, perhaps sharply depressed. These economic sectors—at least in their conventional form—are unlikely to recover to anything close to their pre-pandemic level of activity.
Maybe we should get serious about elimination.
April 22, 2020
Update
I’ve not commented on the pandemic for a couple of weeks, as I’ve been waiting for strong signals to emerge from the noise, especially regarding economic repercussions. Some things are becoming clearer now. Below are a few highlights on economic repercussions; in the next couple of days, I’ll report on important recent developments in COVID-19 science.
The world currently has over 2.6 million document cases of COVID-19, increasing at about 75,000 a day. The actual number of infections is likely at least 10 times as large (25 million), and perhaps as much as 50 times as large (over 100 million). Total documented deaths are over 180,000, with about a quarter of those in the United States alone. Documented cases in the US have averaged about 25-30,000 a day (or about 40 percent of the world’s total) since early April, and deaths between 1,500 and 2,500 a day for two weeks. The curve in the US may have flattened, but so far there’s little evidence that curve is declining from a very high level of daily cases and deaths.
Inter-systemic effects:
The pandemic’s consequences are ramifying powerfully through humanity’s economic, energy, food, and social systems. Policymakers are now operating far outside the boundaries of their standard cognitive frames and conventional policy models and procedures.
Late-March, financial system shock:
An April 14 article in the Guardian by Adam Tooze, a professor of history at Columbia University, describes how close the global financial system came to collapse in mid-March and how far the rules had to be bent to maintain liquidity and credit in financial markets.
The immediate crisis was averted when the US Federal Reserve became the backstop to the central banks of other rich countries. Tooze writes: “The ECB, the Bank of Japan, the Bank of England and their advanced-economy counterparts all enjoy the Fed’s direct support.” (The Fed provides, among other services, swap lines so that the central banks of a select group of countries can access US dollars to maintain liquidity in their markets.) Together, these central banks have sucked up vast quantities of government (national, state/provincial, and municipal) debt and corporate debt. “In the final days of March,” Tooze notes, “the [US] Federal Reserve was buying Treasury bonds and mortgage-backed securities at the rate of $83bn per day, or just shy of $1m per second.” As the economic disruption has continued, central banks have moved down the quality hierarchy towards junk bonds, buying debt of progressively lower quality in order to keep large corporations solvent.
The energy domino:
The next domino to fall will likely be in the energy sector. Once again, no clear principles or rules exist to guide policymakers’ responses to near-zero or even negative oil prices. This Oil Price.com chart at 3 pm EDT, April 20th, shows West Texas Intermediate crude trading at -$37 per barrel (all prices in US dollars).
The negative price was partly a quirk of the expiration dates of futures contracts. But such radical anomalies indicate that normal processes of system management are breaking down. World oil production is currently exceeding consumption by about 30 million barrels a day. Storage capacity will probably be filled within a month to six weeks. Production at many oil fields can’t be shut down completely, without permanent damage to the fields. When storage is no longer available, some oil prices may again fall below zero. As of 6:30 pm EDT on Wednesday, the price for Western Canadian Select (WCS, Canadian heavy crude) was -$3.83.
Cushing, Oklahoma storage for North America crude is now 80 percent full and will be completely full in about 10 days. According to Reuters, the amount of crude stored in oil tankers worldwide is approaching 200 million barrels, including 60 VLCCs (very large crude carriers), supertankers than can hold 2 million barrels each, up from 10 VLCCs used for storage in February. Maximum tanker storage globally is likely about 300 million barrels.
Complete loss of storage slack in the world’s oil production and trading system removes buffering capacity from world oil markets, so overproduction will translate into immediate downward pressure on oil prices.
It’s worth noting that WCS is among the world’s most expensive and dirtiest oil (in terms of carbon intensity). I don’t see any scenario going forward, at least over the next two years, in which WCS prices will rise above the $60-80 price needed to justify further investment in green-field oil sands production in Alberta. I believe we’re seeing the beginning of the end of heavy oil production in the province.
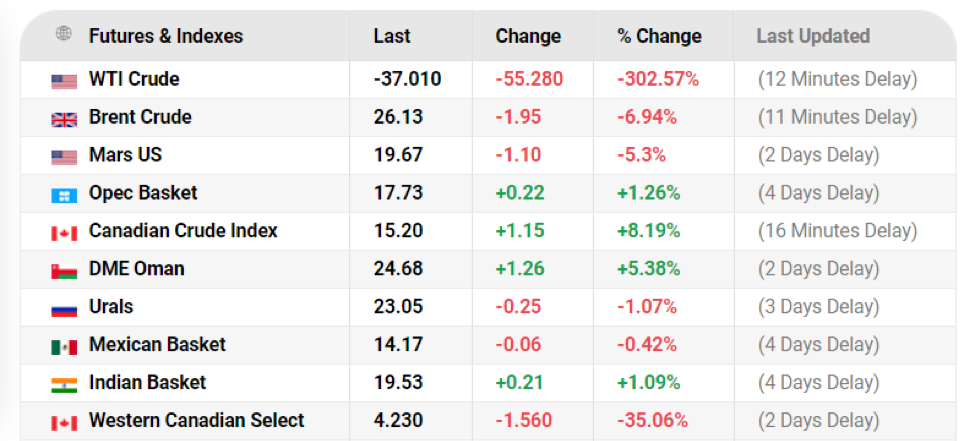
The larger economic consequences of near-zero oil price are almost incalculable. In the United States alone, according to the New York Times, citing Moody’s, “production companies have $86 billion in debt coming due between 2020 and 2024, and pipeline companies have an additional $123 billion they have to repay or refinance over the same period.” While the “supermajor” oil firms (Exxon Mobile and the like) will likely survive through heavy borrowing, perhaps from government, a large numbers of smaller production firms in the US, especially “tight oil” (fracking) producers in Texas and the Dakotas that are already highly leveraged, will go bankrupt. The number will depend on the prevailing price for WTI crude, as show in this screen grab from an April 22 CNBC report:

A wave of de facto nationalizations:
As the central banks of wealthy countries step in to rescue failing firms, we’re likely to see a massive structural reorganization of wealthy economies, setting the stage for the de facto nationalization of major sectors—from energy industries, to agriculture and food production, to transportation. For instance, on Monday (April 20) United Airlines announced a $2.1 billion pre-tax loss for the first quarter; during the last two weeks of March, the company was losing $100 million a day. United intends to seek a total of $9.5 billion in relief from the US government and the US Treasure Department—$5 billion in payroll coverage and $4.5 billion from the US Treasury in loans. The New York Times noted that “if it borrows the full amount, United would issue warrants for the Treasury to buy 14.2 million shares at its April 9 closing price of $31.50 per share.” In other words, the US government will have the option of buying a large interest in United Airlines in return for the loans it provides. This is probably just the beginning of such arrangements, which echo the position the US government took in General Motors in the wake of the 2008 financial crisis.
De facto nationalization could extend beyond large industrial and transport firms into the insurance, banking, and health sectors. In Ontario, doctors are starting to close their clinics, because the fee-for-service billing arrangement has dramatically cut their incomes, as patients stay away from doctors’ offices. The Globe and Mail quoted Ontario Medical Association president Sohail Gandhi: “Over the past couple of weeks, we’ve been trying to let the ministry know that without some form of stabilization funding for health care infrastructure, the system is heading for a collapse, frankly, because our survey shows 49 per cent of all physicians are considering closing their clinics for a month or more.” Something akin to public sector salaries for doctors may soon be necessary, just as the federal government’s Canadian Emergency Response Benefit (CERB) could evolve into a universal basic income, as suggested here.
Knock on effects in developing countries:
The global economy is facing a high risk, now, of a wave of sovereign defaults, as developing countries—whose expenditures are soaring in response to the pandemic—find they can’t service their external debts. (Much of this debt is denominated in US dollars, a currency that has been rapidly increasing in value as a safe haven; the rising dollar in turn increases the burden of debt repayment.) Maitreesh Ghatak, Xavier Jaravel and Jonathan Weigel, professors at LSE, write in the New York Times that while “The coronavirus has not yet exploded in the developing world, . . . poor countries are already suffering from the pandemic. Their economies have been battered by lockdowns, falling commodity prices, declining remittances, and unprecedented capital flight. Some $100 billion has fled emerging markets since January, five times more than in the 2008 crash.”
Unlike rich countries with backing from the US Federal Reserve, these countries have extremely limited borrowing options. Ghatak and colleagues continue:
Many already face debt crises, ruling out further borrowing. Even fast-growing economies are in trouble: Ghana and Ethiopia, averaging 5 to 6 percent growth in the past decade, now face insolvency. Middle-income countries like Turkey and South Africa are also on the brink.
Rich countries must help or face economic meltdowns from Pakistan to Peru. Failure to act wouldn’t just lead to a series of chaotic defaults and disrupt international supply chains as companies are shuttered the world over. It would also be a humanitarian catastrophe.
Writing in Bloomberg Opinion, George Soros and economist Chris Canavan note that JPMorgan Chase & Co. predict that “1 in 5 emerging-market countries will default on their debt obligations.” They call for a deferral of all payments to international creditors for at least one year. Ghatak and colleagues argue for the creation of a Global Solidarity Fund:
What the world needs now is on the order of the Marshall Plan: a fund to transfer resources immediately to the developing world on a massive scale. We like to call it a Global Solidarity Fund.
Countries able to borrow cheaply would take a G.S.F. pledge to commit 1 percent of their gross domestic product to a trust dedicated to the global pandemic response. Initially, funds would be channeled through existing emergency mechanisms: the United Nations’ Global Humanitarian Response, the World Health Organization’s Health Emergencies Program and the World Bank’s Pandemic Emergency Financing Facility. Relief could begin flowing immediately.
They acknowledge that the chances of the United States participating in such a fund currently are minimal, as the country is “bereft of leadership.” Nuff said.
April 3, 2020
COVID-19 science: Aerosol transmission
Underneath the current debate surrounding whether people should be advised to wear masks in public are rapid developments in understanding the dangers of aerosol transmission of SARS-CoV-2. New evidence shows that the virus can travel more than two meters and remain infectious in aerosol-sized particles (those under 5 micrometers) expelled through regular breathing (i.e., without sneezing or coughing). The widely cited March 17 Lancet article “Aerosol and Surface Stability of SARS-CoV-2 as Compared with SARS-CoV-1” highlighted the virus’s viability on different surfaces—such as copper, steel, and cardboard—but the data on aerosol viability were just as significant and less-noticed at the time.
A subsequent article in the New York Times notes that “The finding on aerosol in particular is inconsistent with the World Health Organization’s position that the virus is not transported by air.” Quoting the study’s lead, Dr. Vincent Munster, a virologist at the National Institute of Allergy and Infectious Diseases, the article goes on to say:
To assess the ability of the virus to survive in the air, the researchers created what Dr. Munster described as “bizarre experiments done under very ideal controllable experimental conditions.” They used a rotating drum to suspend the aerosols, and provided temperature and humidity levels that closely mimic hospital conditions.
In this setup, the virus survived and stayed infectious for up to three hours, but its ability to infect drops sharply over this time, he said.
He said the aerosols might stay aloft only for about 10 minutes, but Dr. Linsey Marr [an expert at Virginia Tech on aerosol transmission of viruses who was not a member of the research team] disagreed with that assessment, and said they could stay in the air for three times longer. She also said that the experimental setup might be less comfortable for the virus than a real-life setting.
For example, she said, the researchers used a relative humidity of 65 percent. “Many, but not all viruses, have shown that they survive worst at this level of humidity,” she said. They do best at lower or much higher humidity. The humidity in a heated house is less than 40 percent, “at which the virus might survive even longer,” she said.
Mucus and respiratory fluids might also allow the virus to survive longer than the laboratory fluids the researchers used for their experiments.
Other experts said the paper’s findings illustrate the urgent need for more information about the virus’s ability to survive in aerosols, and under different conditions.
Strong anecdotal evidence of aerosol transmission comes from an incident in Mount Vernon (Washington State), in which a choir rehearsal on March 10 resulted in a COVID-19 outbreak that has so far sickened dozens and killed two people. A March 29 article in the Los Angeles Times noted:
Sixty singers showed up. A greeter offered hand sanitizer at the door, and members refrained from the usual hugs and handshakes.
“It seemed like a normal rehearsal, except that choirs are huggy places,” [the choir’s conductor Adam] Burdick recalled. “We were making music and trying to keep a certain distance between each other.”
After 2½ hours, the singers parted ways at 9 p.m.
Nearly three weeks later, 45 have been diagnosed with COVID-19 or are ill with the symptoms, at least three have been hospitalized, and two are dead.
The outbreak has stunned county health officials, who have concluded that the virus was almost certainly transmitted through the air from one or more people without symptoms
Estimate of current number of actual infections on Vancouver Island
On March 22, I said we’d likely see a COVID-19 death on Vancouver Island in the next two weeks. Yesterday, two deaths were announced. Using Michael Lin’s method, these deaths can anchor an estimate of the total number of infections to date (including those of people who have recovered) on the Island.
If we assume (as Lin does) an infection fatality rate of 1 percent and three to four weeks between infection and death, then the two deaths announced today suggest the Island had about 200 infections three to four weeks ago—say, on Sunday March 8. International evidence indicates that infections double every week in the absence of aggressive closure of businesses and social distancing. Those measures were widely adopted in BC around March 18. So, applying this growth rate, we had about one and a half doublings (to 600 infections) before the 18th. At that point, using my March 22 assumption, the rate of doubling dropped to once every two weeks. This gives us an estimate of about 1,200 infections on the Island to date, or about one for every 725 people.
This number is over twice the rough estimate provided by BC’s health authorities, a week ago (on March 28). Bonnie Henry estimated that BC had a total of 2,000 to 3,000 infections, or on a proportional basis about 350 to 500 infections on the Island.
If around 1,200 people on the Island are (or have been) infected, some 75 have tested positive, and about a fifth of the remainder have likely recovered. That leaves about 900 people with current infections, about half of whom are likely asymptomatic. The rest, some 450 people, think (or hope) they simply have a cold or a mild case of the flu; some of them are certainly self-isolating.
It’s worth noting that experts are vigorously debating SARS-CoV-2’s infection fatality rate, with some suggesting the IFR is closer to 0.5 percent. If that’s indeed the case, then the number of current (and recovered) infections on the Island is about 600.
March 30, 2020
Update
For a moment’s light diversion, this video indicates the kind of reaction online learning may provoke in some communities in coming weeks and months.
The video—only three minutes long—has been translated into twenty languages and already watched millions of times.
Assessment of BC hospitalization modeling:
British Columbia’s public health authorities released results of their hospitalization models on Friday, March 27th. I’ve reviewed the models’ assumptions and results against other models and data. A key thing to keep in mind is that these are not epidemiological models; they don’t generate estimates of the incidence of COVID-19 and the associated mortality and morbidity rates in BC from underlying parameters such as the virus’s assumed reproduction rate and infection fatality rate. Rather they use data on how the COVID-19 pandemic has developed in other jurisdictions—in particular, South Korea, Hubei, and northern Italy—to estimate the province’s coming need for acute and critical care hospital beds and ventilators.
The models suggest that BC should be able to cope—just—with a worst-case COVID-19 trajectory that resembles the northern Italian experience. I think they’re likely correct, with a couple of caveats.
First, this chart, which appeared early in Friday’s technical presentation, is misleading.
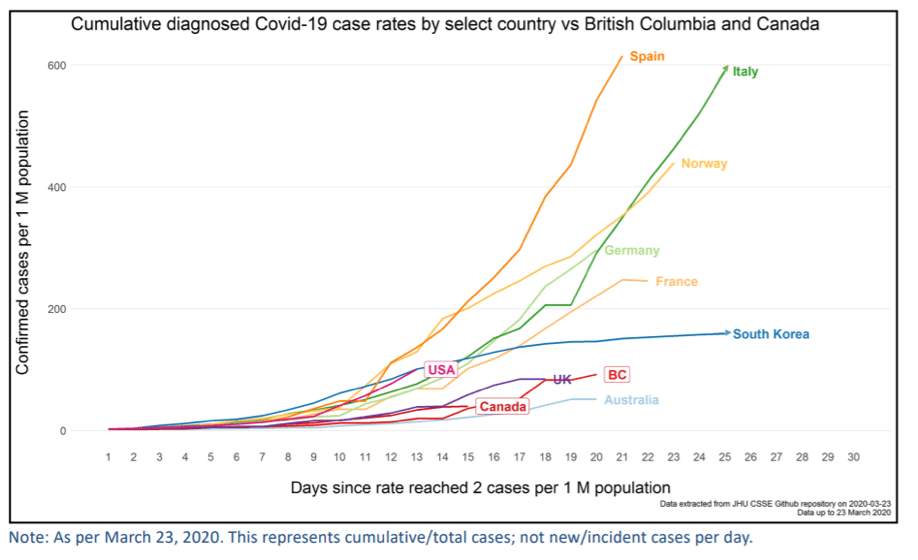
Looking at the green line that represents Italy, one would assume that the number of “Confirmed cases per 1 million population” was about 600 on March 23. In fact, the figure was over 1,000; and as of today, the figure is over 1,600. In the chart, the green line simply ends at the top boundary and doesn’t represent the actual figure for Italy on March 23.
The Lombardy region—the worst-case comparison case for the BC models—had 3,480 cases per million on March 26, as shown in the table below (published in the New York Times). While the BC models may have used a figure of this magnitude in estimating the worst-case hospitalization load for the province, nothing of the kind appears anywhere in the slide deck I reviewed.
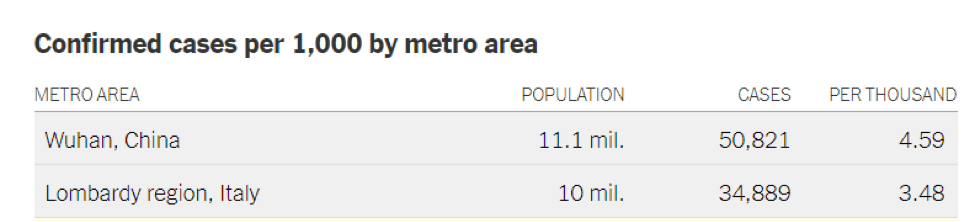
We can, however, use this figure to estimate the total number of critical care hospitalizations the province will experience if it follows a north-Italian trajectory. Taking BC’s population as 5.1 million, a confirmed case rate of 3,480 cases per million produces a total of about 17,750 cases during the entire course of the pandemic. If we use the BC models’ assumption that “4.7% of all COVID-19 cases will be admitted to critical care,” then the province can anticipate a total of 834 critical care patients through the course of the pandemic.
According to the BC models, under the worst-case northern Italian scenario, COVID-19 induced demand for critical care in the province will peak at about 215 beds, 33 days into the province’s epidemic. If the total load turns out to be something in the vicinity of 834 critical care patients, however, this estimated peak requirement for beds may be too low. Much depends on the figure used for “average length of stay” (ALOS) in critical care, which the BC models put at 10 days. The shorter the ALOS, the lower the peak demand. Michael Lin, in his slides on COVID-19 that I cited last week (updated to yesterday), notes that the “average hospital stay is 3 weeks.” The ALOS in critical care will be shorter than this period, of course, because the patients there will either die or be moved to acute care as their condition improves. Nonetheless, the 10-day ALOS in the BC models seems arbitrarily short.
Also, notice that the fine print on the key slide (see below) says that the Italian epidemic had not, at the time the models were run, reached its peak. (The peak may have happened in the last couple of days.) Given that the full severity of the north-Italian epidemic was not known at the time, I find it odd that the models would be used to conclude that BC will be able to cope with an epidemic of that magnitude.
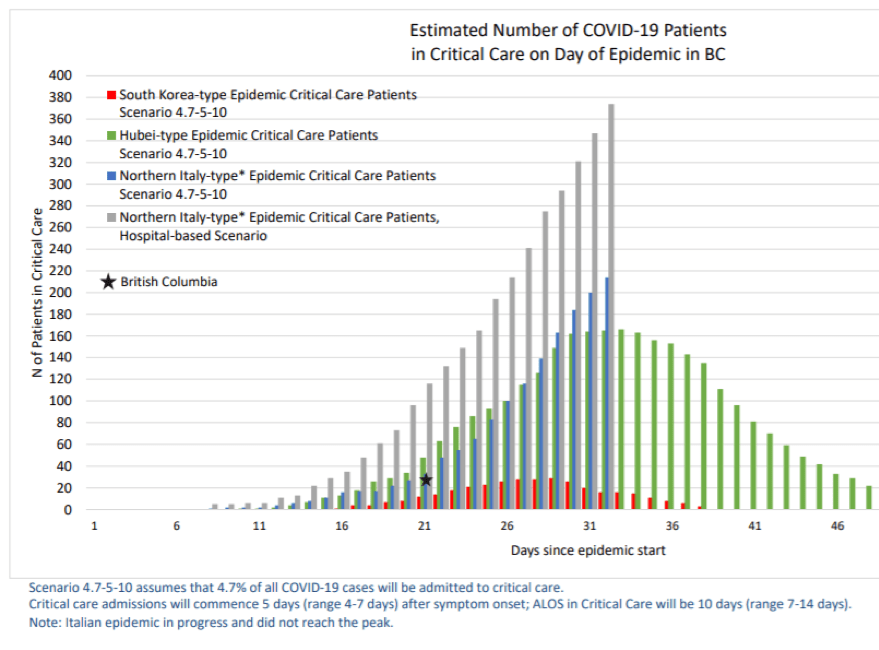
These caveats aside, the BC models’ approach and numbers appear sound on balance. The advanced preparations (especially cancelation of elective surgeries) to create surge capacity in the province’s health care system will likely be enough to cope with the predicted wave of hospitalizations in coming weeks.
March 26, 2020
The Tradeoff: “Let it rip” vs. “Lock down”
The debate of the hour concerns whether the cure of shutting down the economy is worse than the damage the disease would do if allowed to run (more or less) its course. Although Trump has voiced this concern most vocally, it has turned up in a variety of ideological spaces, including in this piece last week by Thomas Friedman, who cites the opinion of Yale’s David Katz. Gary Mason once again hits the mark with his review of the issue here. It’s also now the subject of academic discussion and analyses, well-summarized in this just published New York Times article. The first substantial economic model of the tradeoffs by Martin Eichenbaum of Northwestern and colleagues appeared the day before yesterday, and can be found here.
The “let it rip” vs. “lock down” dichotomy is a misleading and false one, I believe. The best approach is clearly something in between. Tomas Pueyo argues for one such approach in his piece in Medium five days ago, “The Hammer and the Dance” (which addresses some flaws in the highly influential Imperial College paper that suggests any relaxation of initial efforts at suppression will allow the virus to reemerge vigorously); and the Eichenbaum paper also identifies a middle road.
However, all such analyses are enormously sensitive to the modeler’s initial choice of parameter values—the pathogen’s attack rate, reproduction number (“R0”), infection fatality rate, and estimated “value” of life. The Eichenbaum paper, for instance, uses a relatively low value for the reproduction number. It also assumes that those who survive infection are substantially immune; therefore, the authors say, the optimal policy response to the pandemic involves a managed increase in a society’s herd immunity.
“Absent vaccines, the only way to prevent a recurrence of the epidemic is for enough of the population to acquire immunity by becoming infected and recovering. The optimal way to reach this critical level of immunity is gradually increase containment measures as infections rise and slowly relaxing them as new infections wane.”
I question this approach, not just because of the extraordinary number of deaths it implies, but also because we still don’t know the degree and duration of immunity of those who have recovered from the disease. Also, as Pueyo argues: “RNA-based viruses like the coronavirus or the flu tend to mutate around 100 times faster than DNA-based ones—although the coronavirus mutates more slowly than influenza viruses.”
In situations of extreme uncertainty like this, I’m a firm believer in the value of quick-and-dirty estimates that provide ballpark figures for comparison. In this case, I think the relative balance of costs of the two approaches—let it rip vs. lockdown—can be clarified by some back-of-the-envelope estimates.
The following are some numbers for Canada:
Let it rip:
If we assume, under this policy approach, that SARS CoV-2 eventually affects two-thirds of the Canadian population—about 25 million of 38 million people—which is a standard “attack rate” figure, and if we assume that the infection fertility rate (IFR) is 1 percent, as Michael Lind argued in the deck I discussed two days ago, then without any efforts to limit infections, Canada would experience nearly 250,000 deaths and about 2.5 million severe illnesses, probably mostly occurring within one year. It’s worth noting that such an outcome would nearly double the total annual deaths in Canada (about 290,000 a year).
But the IFR is almost certainly too low in such a scenario, because the health system would be overwhelmed and ill people (with both COVID-19 and other illnesses) who would otherwise recover would die. Pueyo suggests that, in such circumstances, the case fatality rate from COVID-19 should be doubled from 2 percent to 4 percent. If we similarly assume a doubling of the IFR from 1 to 2 percent, then Canada would experience 500,000 deaths from the 2.5 million cases of severe COVID-19 illness (in other words, the ratio of deaths to severe illness would double).
To estimate how much we’d be willing to pay to avoid such an outcome, we can use a standard “value of statistical life” (VSL) figure of US $6.1 million in 1999 dollars (similar to that used by the US EPA, as outlined in this report here), which converts to US $9.3 million in 2020 dollars. If we discount this VSL by one-third to take into consideration higher average age of those who die from COVID-19, then the imputed value of avoiding the projected COVID-19 deaths alone to Canada is about US $3 trillion. I’d argue that we should escalate this figure by at least a third, to account for the imputed value of avoiding the 2 million cases of severe COVID-19 illness, as well as the imputed value of the collateral deaths resulting from an overwhelmed health system. This suggests we should be willing to pay about US $4 trillion to avoid the deaths that would arise from a “let it rip” policy. Note that this amount is in excess of two years of Canada’s GDP (US $1.74 trillion), and that it does not incorporate the economic costs arising from lost demand and productivity as a result of such a shock, which could themselves be enormous.
Such calculations, of course, are fraught with problems, not least the ethical challenge of putting a value on human life. But the US $4 trillion figure should put an end to the idea that COVID-19 is “just another flu.” The costs to Canada—economically, socially, and morally—of treating this pathogen as “just another flu” are almost beyond imagining.
Lock down:
Most estimates of the consequences of a “suppression” approach to corralling COVID-19, as in the chart below (extracted from the recent Imperial College study), indicate that the approach would achieve mortality and morbidity reductions in the neighborhood of 75 percent.
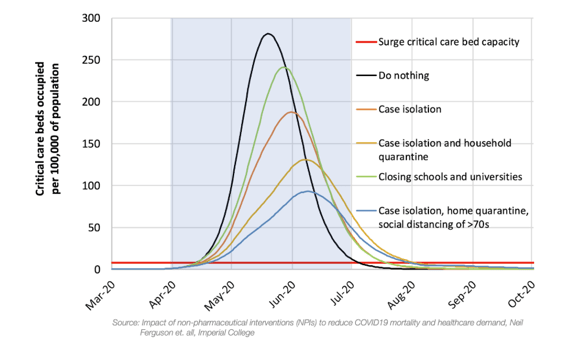
This suggests that “lock down” could reduce the above imputed cost to Canada of illness and lost lives to US $1trillion. But then we should add the costs to the Canadian economy of such an approach because of lost economic activity directly arising from reduced travel, closed commercial facilities, social distancing and the like.
Here even back-of-the-envelope estimates become very difficult, in part because the Canadian economy isn’t isolated from the global economy; the pathogen’s ravages beyond our borders—and policies implemented in response by other countries—are now gravely affecting our economy. So the question then becomes: What is the likely additional cost of “lock down” policies in Canada, given the most probable mix of economic costs inevitably spilling into our country from outside our borders? Put simply, how much extra economic damage will “lock down” cause to our economy beyond what we’re already going to suffer from things happening around the world?
Since the Canadian economy is deeply dependent on trade, we can’t escape the coming global downturn. Various analyses, including an updated assessment by JP Morgan, suggest an immediate global contraction of between 10 and 20 percent of GDP. (The JP Morgan study estimates that the Chinese economy itself contracted over 40 percent this past quarter.) Any contraction exceeding 10 percent, if it extends beyond two quarters, qualifies as a depression. However, most of these analyses also argue that the downturn will be followed by a fast recovery (so the recession or depression will be “V-shaped”). I’ll argue in future posts that there are strong reasons to believe the recovery won’t be so fast.
A reasonable first-order estimate, by my view, is that the global effects of COVID-19 will cause the Canadian economy to contract by 10 percent immediately; then the Canadian economy will recover one third of that amount in each of the three subsequent quarters (i.e., out to the end of the first quarter in 2021). Let’s assume that domestic “lock-down” policies of eight-weeks’ duration (in line with Pueyo’s “hammer” approach) double that economic impact, so the immediate total effect is a 20 percent contraction, with a one third recovery for the three subsequent quarters. In this case, the additional lost national income due to “lock down” is about US $110 billion ($43.5 billion in the first quarter—or 10 percent of the quarter’s national income—plus $32.6 billion, $21.7 billion, and $10.9 billion in the subsequent three quarters).
On balance, then, it appears that the incremental cost to Canada of the “lock down” policy would be less than half of the imputed cost of death and sickness under the “let it rip” policy.
In sum, the idea that the cure (defined as lock down) is worse than the disease (defined as let it rip) is almost certainly wrong.
March 24, 2020
COVID-19 Science
Three items strike me as important.
The First
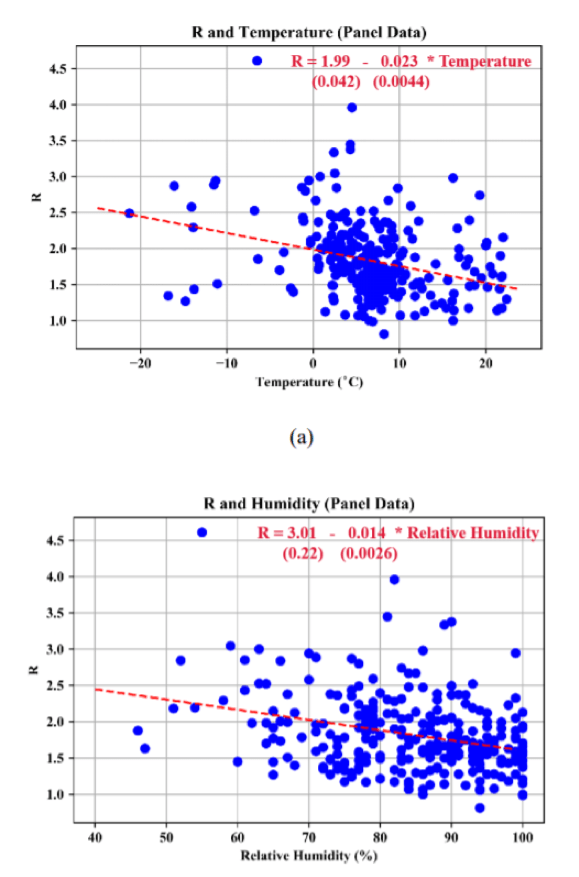
The first is a research paper, “High Temperature and High Humidity Reduce the Transmission of COVID-19,” by Chinese researchers Wang et al.; it can be found here: https://papers.ssrn.com/sol3/papers.cfm?abstract_id=3551767The paper correlates temperature and humidity with the coronavirus reproductive number, R, across 100 Chinese cities from January 21 to 23. The abstract states: “We find, under a linear regression framework for 100 Chinese cities, high temperature and high relative humidity significantly reduce the transmission of COVID-19, respectively, even after controlling for population density and GDP per capita of cities. One degree Celsius increase in temperature and one percent increase in relative humidity lower R by 0.0383 and 0.0224, respectively. This result is consistent with the fact that the high temperature and high humidity significantly reduce the transmission of influenza. It indicates that the arrival of summer and rainy season in the northern hemisphere can effectively reduce the transmission of the COVID-19.”The paper has not been peer reviewed yet, and some epidemiologists have been skeptical of the results. But the paper’s key graphs (four reproduced below) are notable:
The following two maps extrapolate the results to show the possible seasonal difference globally from this March to July.
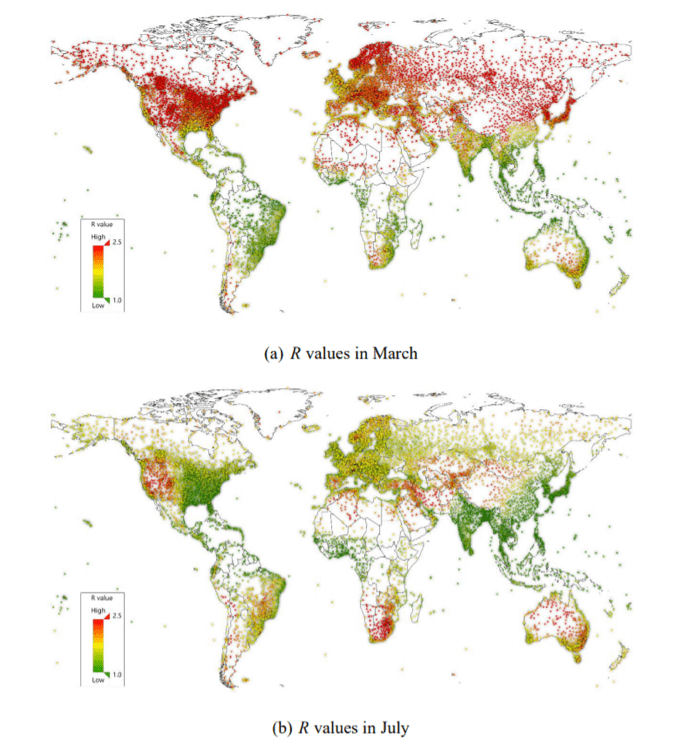
The paper’s findings could help explain the observed gradient of the disease in the United States, where northern states are seeing more severe outbreaks than those in the south. On this matter, President Trump, alas, may be right.
The Second
The second item of interest is this report in Buzz Feed on the results of testing in Iceland, where a far larger portion of a population has been tested that anywhere else. The research indicates a very high rate of asymptomatic transmission.The article says: “The number of individuals tested by the country’s health authorities and the biotechnology firm deCode Genetics — 3,787 — roughly translates to 10,405 per million, which compares to about 5,203 in South Korea, 2478 in Italy, and 764 in the UK.”Thorolfur Guðnason, Iceland’s chief epidemiologist, said: “Early results from deCode Genetics indicate that a low proportion of the general population has contracted the virus and that about half of those who tested positive are non-symptomatic. The other half displays very moderate cold-like symptoms.”The article concludes: “The testing has provided evidence revealing that a significant portion of those who catch the disease do so with no or mild symptoms — and confirmed multiple pieces of research that have shown that asymptomatic individuals contribute to the transmission of the disease in great numbers.”
The Final
The final item is this paper in The New England Journal of Medicine published yesterday on the problem of triage, titled “Fair Allocation of Scarce Medical Resources in the Time of COVID-19.” The article discusses the ethics of triage, and considers six specific recommendations for allocating medical resources in the crisis: “maximize benefits; prioritize health workers; do not allocate on a first-come, first-served basis; be responsive to evidence; recognize research participation; and apply the same principles to all Covid-19 and non–Covid-19 patients.” This will likely become the go-to article for triage committees to guide their decision making.
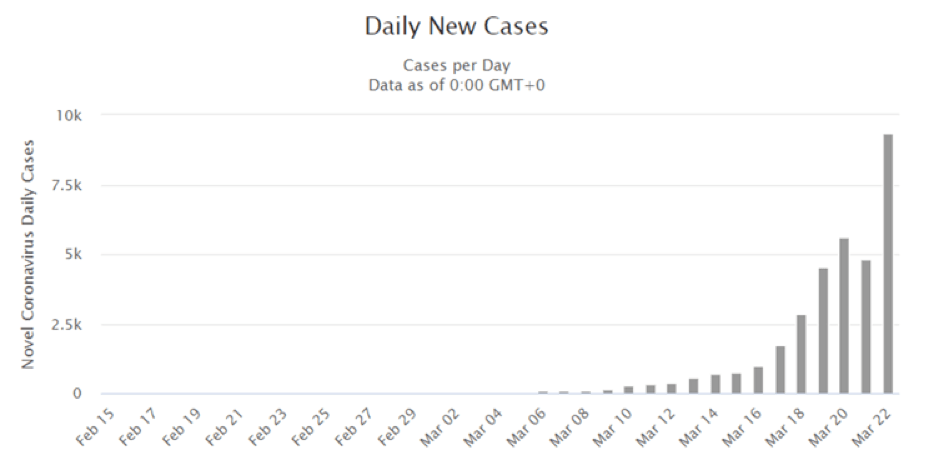
The US situation: While the daily growth rate shows Italy has turned the corner:
The growth rate in the US remains stunning:
According to the New York Times earlier today, Andrew Cuomo, the governor of New York says that “the state now projects that it may need as many as 140,000 hospital beds to house virus patients, up from the 110,000 projected a few days ago. As of now, only 53,000 are available. Up to 40,000 intensive-care beds could be needed.”
We’re seeing a health catastrophe unfold in New York that will probably exceed that of Wuhan itself. More generally, the coronavirus emergency seems to dramatically exacerbated by a host of systemic failures in the United States economy, culture, social structure, and political system: these include enormous inequalities in wealth and availability of health care at the individual and community levels, a pathological culture of individualism, severe regional and racial socio-economic divisions, deep political polarization, a fractured and discordant federal system, episodes of near paralysis in the federal legislature, and thoroughly incompetent presidential leadership. It’s hard to image a mixture of social properties that could more effectively hinder an effective response to this crisis in an otherwise wealthy country.
March 22, 2020
COVID-19 Science
The slide deck at the following link is from a talk by Michael Lin, an Associate Professor of biochemistry and neurobiology at Stanford. It’s by far the best technical summary I’ve seen of all the relevant science:
https://drive.google.com/file/d/1ZaiDO87me4puBte-8VytcSRtpQ3PVpkK/view
It’s a densely packed short course in 37 slides, updated to yesterday. If you can spare 45 minutes, it’s well-worth the time. It covers definitional confusion surrounding the pandemic; health impacts on the individual; infection rates and likely trajectories; what kills the virus; promising existing treatments; prospects for vaccines; and policy failures by the US CDC and FDA. The “Recommendation” slides at the end detailing personal hygiene measures (some of which differ from conventional advice) are themselves invaluable.
Italy turns the corner; but the US?
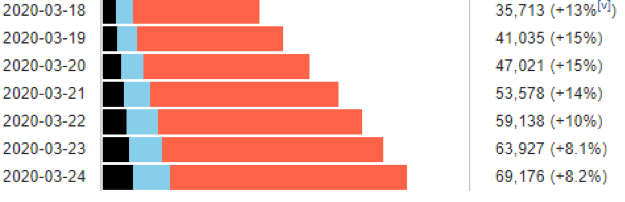
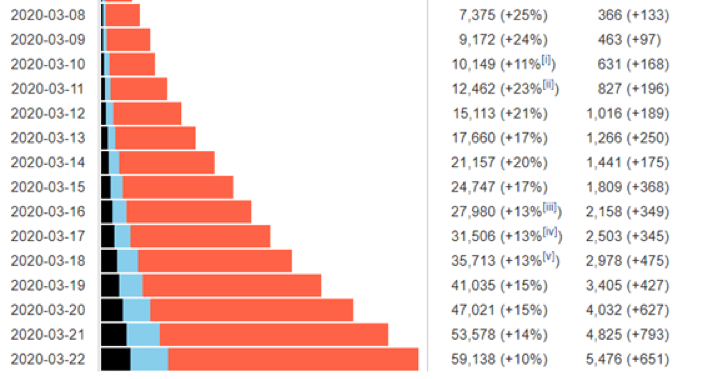
Italy extended its “red zone” restrictions on commerce, gatherings, and movement to the entire nation on March 9. The policies are now having the desired effect. The daily growth of cases has dropped from around 25 percent in the first third of March to 10 percent yesterday. This is the lowest daily growth rate since the beginning of the crisis in the country. The absolute number of additional cases per day is still rising (5,476 yesterday, up from 4,825 the day before), but that figure should start to fall soon too.
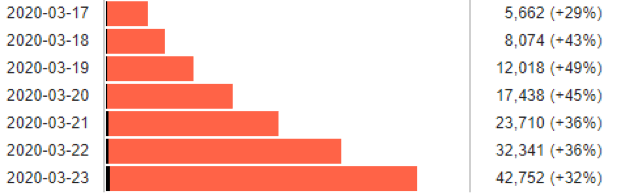
Meanwhile the growth in the US is astonishing (see chart below), especially in New York City, which now has almost 16,000 cases. The total number of cases in the US (now over 33,000, up 9,340 since yesterday) will probably exceed Italy’s this week.
Projection of infections on Vancouver Island:
Michael Lin, in his slides (9 through 15), walks through a calculation of current and projected infections for California; I’ve used his approach to estimate the same numbers for Vancouver Island.
I’m going to “nerd out” for a moment (my MIT training is kicking in), but it’s important to lay out how I ran this calculation. Feel free to skip the following paragraphs, to reach the conclusion below.
The number of diagnosed cases in a region is not terribly useful for tracking the course of an epidemic, because the figure is influenced by a host of extraneous factors, including rates of (and criteria for) testing. Instead, one wants to get at the underlying number of infections by the pathogen—in this case the SARS-CoV-2 virus. The total number of infections will be the total of documented cases of COVID-19 (from positive tests), of undocumented cases of COVID-19, and of SARS-CoV-2 infections that are asymptomatic and haven’t resulted in the disease COVID-19.
The best way to calculate the total infections is to work back from the number of deaths. Lin starts from the 10 deaths in California in the week before March 18; he assumes a lag time of 4 weeks before death; and he assumes, based on evidence to date from around the world (slide 10), that the SARS-CoV-2 Infection Fatality Rate (IFR) is 1 percent. Based on these assumptions, he estimates that 4 weeks before March 18th California had 1,000 infections.
Island Health hasn’t had a death yet, which means we have to interpolate some numbers. Thirty cases had been diagnosed on the Island as of March 20, and the figure will probably pass 50 in the next week. Given that the case fatality rate is around 2 percent, we can expect the first death on the Island in the next two weeks. If it happens a week from now, then using an IFR of 1 percent, and walking back four weeks, there were about 100 infections on the Island three weeks ago.
Lin estimates, based on an average of data from countries outside China (slide 12), that new infections double every week. So we likely had somewhere around 400 new infections on the Island this past week (starting with 100 three weeks ago, then 200 new infections the following week, and 400 last week), for a total of about 700 infections currently on the Island as a whole. That’s about 1 in every 1,200 people on the Island (total population about 800,000).
Many people on the Island now seem to have adopted social distancing practices, so let’s assume the rate of new infections drops sharply going forward, and the doubling time for new infections increases from one week to two (a big and important assumption). So, in two weeks the Island will have 800 new infections, and two weeks after that (April 20), another 1,600. At that point the total number of infections (some of which will have resolved by then) will be 3,100 (700 today, plus 800 two weeks from now, plus 1,600 in four weeks).
On slide 15, Lin writes that an “estimated 5% of total infected (not diagnosed) cases require hospitalization and 2.5% require ICU. Average hospital stay is 3 weeks, and starts 2 weeks after infection (1 week after diagnosis).“ So the total of 3,100 people on the Island who are infected in four weeks will produce (over the course of their illnesses) about 150 hospitalizations and 75 people requiring intensive care and ventilation.
Island Health has 96 ICU beds and 140 ventilators. Given that many of those ICU beds will be occupied by people with other health crises, it would seem likely that at least some of the extra 75 people requiring ICU care in four weeks will not receive that care.
The bottom line is that the health care crisis on the Island will probably become acute about the end of April.
March 20, 2020
COVID-19 Health Care Response
The most notable development on this topic is the now-open conversation about the necessity of triage. The discussion seems to be most advanced in Washington state, where medical leaders are quietly developing triage policy. The NY Times says: “The triage document, still under consideration, will assess factors such as age, health and likelihood of survival in determining who will get access to full care and who will merely be provided comfort care, with the expectation that they will die.” Gary Mason discusses the ethical challenges in his column in the Globe today.
March 19, 2020
COVID-19 Science
The world will pass ten thousand COVID-19 deaths today.
However, with news yesterday that China had its first day of no new local infections (although 34 came from outside the country’s borders), the debate now seems to be focusing on “where are we on the curve?”
This article, just published in the NY Times, includes curves for a large number of countries (at the bottom) that can be skimmed quickly:
This screen grab gives you a sense for the divergence in national trajectories:
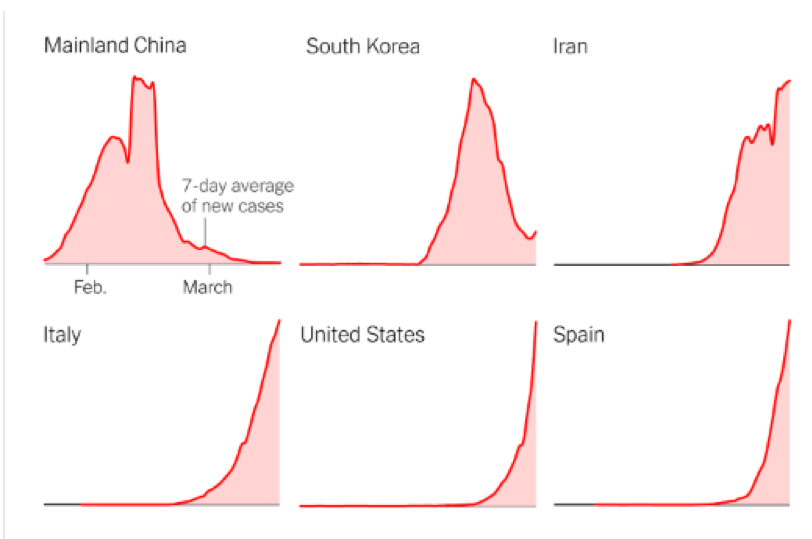
In looking through the data, I’m struck by the sharp uptick in recent days in Singapore, Hong Kong and Taiwan, all of which seemed to be flattening the curve successfully a few days ago. The situation in Italy remains critical, with just over 400 new cases yesterday. But there’s a hint that the curve may have shifted from exponential to linear in the last four days.
China and South Korea have shown that it’s possible to corral the infection, but they’re now engaged in an experiment that the whole world will be watching: Can they relax the social and economic controls without a resurgence of new cases? The Imperial College study I cited yesterday suggests not, and certainly these countries will have to work hard to prevent infections from the rest of the world spilling back across their borders, and this in turn will continue to have implications for critical international supply chains.
An assessment in the NY Times by Ezekiel J. Emanuel (chairman of the department of medical ethics and health policy at the University of Pennsylvania), Susan Ellenberg (professor of biostatistics there) and Michael Levy (professor of epidemiology) gives us a realistic sense for what we can expect. They say we should be ready for a minimum of an eight week of aggressive social distancing. Here are key excerpts:
“A likely scenario is that there will be subsequent waves of the disease. That’s what happened in Denver in the 1918-19 influenza pandemic and in Toronto during the 2003 SARS outbreak. Over the next few months, South Korea, China and other countries will generate some relevant evidence to show how this might play out.
The next round of social distancing will be activated more rapidly, because officials — and the public — will be more prepared. It should also be shorter, because we can assume that most of the people who were initially infected are likely to be immune next time around. But it will still disrupt people’s lives and the economy. We will still have canceled conferences and sporting events. People will not frequent restaurants and will not travel. The service industry will be severely curtailed. And it’s going to happen again and again.
Maybe the best analogy is pumping a car’s brakes on an icy road. Either doing nothing or slamming on the brakes leads to an accident. So we pump the brakes — pushing on the brakes, then easing up, and then applying them again — and after three or four times we slow down enough to stop.
The alternative to this roller coaster would be even more drastic. It would require sustaining social distancing until there are no more cases whatsoever and then closing borders to all travelers — no contact with the outside world — for 18 months or more. While the United States and many other countries, like Denmark and Germany, have instituted travel bans, sealing the country off for over a year until a coronavirus vaccine is discovered seems implausible. But who knows. If the situation becomes dire enough, the previously impossible could become inevitable.”
Note that the “alternative” mentioned in the last paragraph is the “suppression” scenario the Imperial College modelers think will be necessary.
From a complexity science point of view, there seems to be very high “path dependency” of national trajectories, depending on how fast they move at the beginning of the pathogen’s spread in their communities. It appears that a little as a day or two of delay in implementation of these measures can make a world of difference. There will be many doctoral dissertations exploring these data in years to come.
March 18, 2020
COVID-19 Science
The most significant study in the last two days was released by a team of epidemiological modelers under the direction of Neil Ferguson at Imperial College in London: “Impact of non-pharmaceutical interventions (NPIs) to reduce COVID-19 mortality and healthcare demand.”The researchers make two key points: First, “mitigation” efforts to slow the pandemic will not be enough to keep health systems from being overwhelmed “many times over.” Second, more aggressive efforts at “suppression” to actually reverse the progress of the pandemic will have to be sustained (with only the possibility of intermittent, local relaxations) until a vaccine is developed, because the infection will rebound when these measures are substantially relaxed. The researchers say:“Suppression will minimally require a combination of social distancing of the entire population, home isolation of cases and household quarantine of their family members. This may need to be supplemented by school and university closures, though it should be recognised that such closures may have negative impacts on health systems due to increased absenteeism. The major challenge of suppression is that this type of intensive intervention package – or something equivalently effective at reducing transmission – will need to be maintained until a vaccine becomes available (potentially 18 months or more) – given that we predict that transmission will quickly rebound if interventions are relaxed.”Implications: We’re in for a much longer haul than public officials are acknowledging. Markets, I think, are trying to internalize this information, which explains their dramatic decline. But we’re well outside the boundaries of conventional economic models: it’s not at all clear what the economic “floor” will be when significant parts of the world economy are shut down for a year or more—an enormous and sustained contraction of demand.
A paper by Li et al. published two days ago in Science (“Substantial undocumented infection facilitates the rapid dissemination of novel coronavirus, SARS-CoV2”) fills a key gap in knowledge about transmission. Using a statistical analysis of Chinese data, the authors say:“We estimate 86% of all infections were undocumented (95% CI: [82%–90%]) prior to 23 January 2020 travel restrictions. Per person, the transmission rate of undocumented infections was 55% of documented infections ([46%–62%]), yet, due to their greater numbers, undocumented infections were the infection source for 79% of documented cases.”So, to translate to the Canadian situation, before we implemented rigorous travel and social distancing policies (in just the last week), the majority of infections in our country have likely been “undocumented” (exhibiting either no symptoms or symptoms resembling a cold or mild flu). Although these cases were substantially likely less likely to cause other infections than “documented” (test-positive) infections, their higher overall prevalence is likely emerging now as a major source of documented infections. This may explain the jump in the rate of increase in daily infections a week ago, from a percentage figure in the mid-teens to one in the mid-twenties to low thirties. (NB: A daily growth of 25 percent on yesterday’s base of 569 cases gives a total of 8,300 cases in 12 days, and 460,000 cases in 30 days.)Implications: If one were to try to design a pathogen to shut down highly networked economic systems, it would be hard to do a better job than this coronavirus. Its deadly enough to overwhelm our health-care systems if it gets loose, yet stealthy enough that keeping it from getting loose means keeping just about everyone at home, especially anyone with the sniffles, a slight cough, or a headache. Boris Johnson’s pivot in the last two days, apparently influenced by the Imperial College study, shows his government recognized that letting the virus rip through a population (to build herd immunity) isn’t a viable public policy response. But the alternative laid out in the same study—18 months or more of “suppression”—could crush our economies, so it isn’t necessarily better.

Topics
Environmental Stress and Conflict
Societal Collapse
